


Vizgpt
Vizgpt:'Chat-Driven Visualizations'
Tags:Data analysisAI design tools Chat interface Data analysis Data exploration Data Visualization Paid Standard PicksIntroducing VizGPT: A Revolutionary Tool for Data Visualization
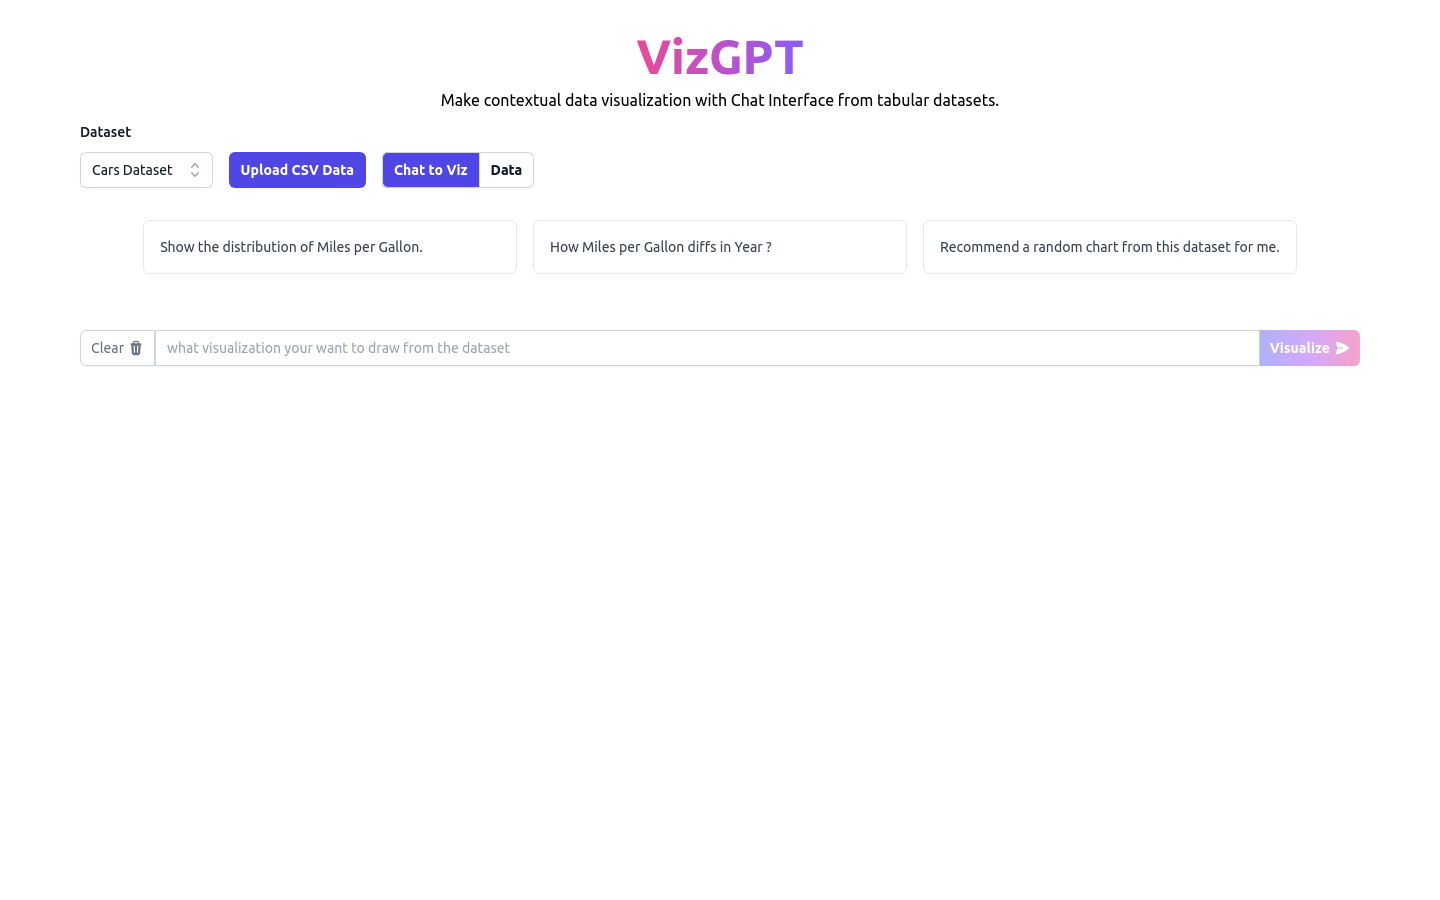
VizGPT represents a groundbreaking advancement in the field of data analysis and visualization. This innovative tool empowers users to create intelligent, context-aware visualizations through an intuitive chat interface. By analyzing tabular datasets, VizGPT generates highly customizable charts that cater to diverse analytical needs.
Key Features
Data Analysis & Visualization: VizGPT excels at transforming raw data into meaningful insights by generating dynamic charts and graphs. Its ability to interpret complex datasets ensures that visualizations are both accurate and easy to understand.
Custom Dataset Management: Users can tailor their datasets according to specific requirements, ensuring that the generated visuals perfectly align with their objectives. This level of customization is unmatched in traditional data visualization tools.
Interactive Editing Capabilities: VizGPT allows for seamless editing of charts and graphs, enabling users to refine their visualizations without any technical barriers. This feature makes it accessible even to those who are not experts in data analysis.
Advanced Features
- Chat-Driven Interaction: Engage with your data through natural language interactions. Simply describe what you need, and VizGPT will generate the appropriate visualizations for you.
- Data Sharing: Easily share your charts and graphs with others, making collaboration and presenting insights more efficient than ever before.
- Premium Features in VizGPT Plus: Upgrade to VizGPT Plus to unlock additional functionalities such as enhanced customization options, advanced editing tools, and priority support. The early bird pricing of $48/year makes this upgrade an attractive option for serious data users.
Who Should Use VizGPT?
VizGPT is designed for a wide range of users:
- Data Analysts & Scientists: Streamline your workflow with powerful visualization tools that enhance your analytical capabilities.
- Marketers: Gain deeper insights into campaign performance through intuitive and customizable visualizations.
- Financial Professionals: Analyze market trends and financial data with precision using VizGPT’s robust charting features.
- Academics & Researchers: Communicate complex data more effectively in publications and presentations.
- Business Users: Make informed decisions by transforming your business data into actionable insights.
Whether you’re a seasoned professional or just starting out, VizGPT offers tools that cater to all levels of expertise. With its user-friendly interface and powerful features, it’s the perfect choice for anyone looking to unlock the full potential of their data.
Don’t miss out on the early bird pricing – subscribe today for only $48/year and experience the future of data visualization with VizGPT Plus!


